


| Item | FY2023 | FY2024 | FY2025 | |||
|---|---|---|---|---|---|---|
| First half | Full year | First half | Full year | First half | ||
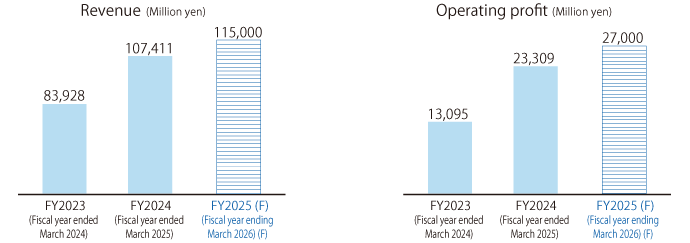
| Revenue (Million yen) | 40,294 | 83,928 | 49,795 |
107,411
|
60,054 | |
| Operating profit (Million yen) |
5,941
|
13,095 |
9,916
|
23,309
|
15,208
|
|
| Profit attributable to owners of parent (Million yen) |
2,191
|
5,376 | 4,813 | 10,901 | 7,145 | |
| Basic earnings per share (Yen) |
45.73
|
112.57 | 101.96 | 231.55 | 153.40 | |
| Total assets (Million yen) |
111,443
|
117,714 | 118,399 | 127,306 | 130,122 | |
| Total equity (Million yen) |
69,378
|
72,361 | 78,766 | 84,114 | 90,724 | |
Business Performance
Financial Highlights (Consolidated)
Business Performance (Consolidated)