


| Item | FY2023 | FY2024 | FY2025 | ||||
|---|---|---|---|---|---|---|---|
| Consolidated | Non- consolidated |
Consolidated | Non- consolidated |
Consolidated | Non- consolidated |
||
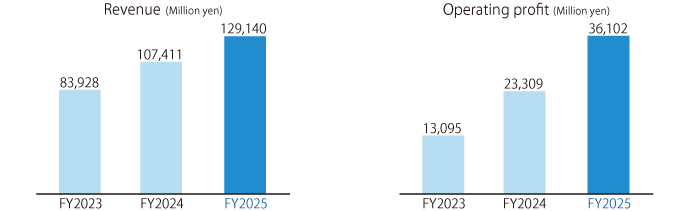
| Revenue (Million yen) | 83,928 | 28,647 | 107,411 | 27,215 | 129,140 | 25,561 | |
| Operating profit (Million yen) | 13,095 | -718 | 23,309 | -77 | 36,102 | 2,464 | |
| Profit attributable to owners of parent (Million yen) |
5,376 | 3,364 | 10,901 | 6,645 | 16,745 | 6,964 | |
| Basic earnings per share (Yen) |
112.57 | 70.17 | 231.55 | 139.72 | 361.20 | 148.28 | |
| Total assets (Million yen) | 117,714 | 38,813 | 127,306 | 36,466 | 154,055 | 38,970 | |
| Total equity (Million yen) | 72,361 | 19,779 | 84,114 | 23,278 | 106,477 | 26,031 | |
| Equity attributable to owners of parent per share (yen) |
1,190.52 | 410.18 | 1,327.03 | 491.14 | 1,719.40 | 558.76 | |
1. All fractions of monetary units have been rounded down.
2. Under the non-consolidated operating results, net sales, operating income, net income and net income per share, total assets, net assets, net assets, per share are indicated.